Sunday 15 November, 13:30 MSK · Novosibirsk
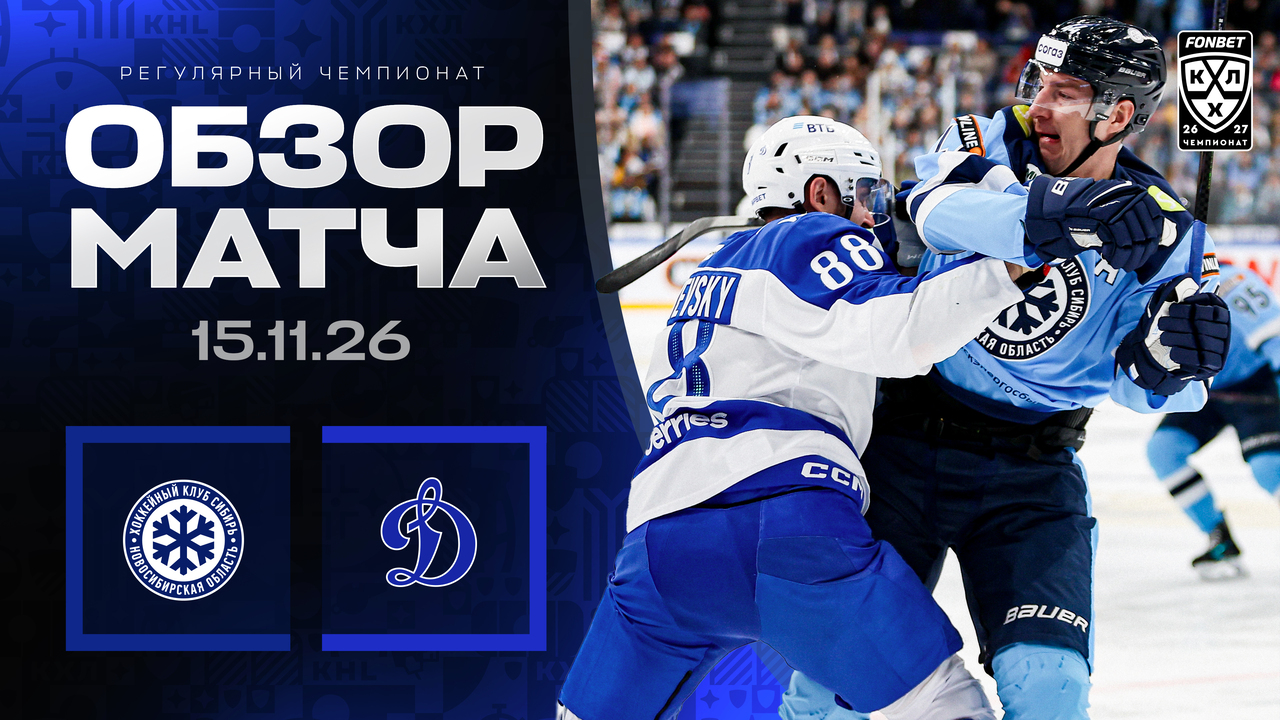
Sibir vs Dynamo Moscow: prediction
final13:30 MSK
СИБSibirhome
1:3
Dynamo MoscowawayДИН
Game stats
Goals
1st period
- 8:120:1Maxim Letunov (Dynamo Moscow) · assists: Luka Profaca, Nikita Korostelyov▶ video
- 9:120:2Artyom Blazhiyevsky (Dynamo Moscow) · assists: Pavel Shen, Bulat Shafigullin▶ video
- 19:360:3Pavel Shen (Dynamo Moscow) · assists: Bulat Shafigullin▶ video
2nd period
- 3:431:3Yegor Alanov (Sibir) · assists: Arkhip Nekolenko, Yegor Korshkov▶ video
Teams
| Sibir | Dynamo Moscow | ||
|---|---|---|---|
| Shots on goal | 32 | 21 | |
| Expected goals (xG) | 2.88 | 1.53 | |
| From the crease and slot | 12 | 7 |
By period
| Goals | Shots | |
|---|---|---|
| 1st period | 0 : 3 | 5 : 10 |
| 2nd period | 1 : 0 | 15 : 5 |
| 3rd period | 0 : 0 | 12 : 6 |
Where the shots and goals came from
Sibir · 32 shots with coordinates
Crease · 0 of 6▲ more shots from here
Right point · 1 of 5★ goal from a low-percentage spot
What stands out
★ goal from a low-percentage spot2Right point: 1 of 5 went in; the league scores on 3.1% of shots from here
▲ more shots from here1Crease: 6 shots — Sibir usually has 2.2 per game (league 2.5)
All 16 zones
| Zone | Shots | Goals | Average per game | League shooting % |
|---|---|---|---|---|
| Left point | 7 | 0 | 5.1 | 4.0% |
| Crease▲ | 6 | 0 | 2.2 | 20.0% |
| Center point | 6 | 0 | 3.2 | 4.6% |
| Right point▲ | 5 | 1 | 5.2 | 3.1% |
| High slot | 2 | 0 | 1.5 | 12.0% |
| Slot | 1 | 0 | 1.9 | 16.4% |
| Low right | 1 | 0 | 0.8 | 13.0% |
| Low left | 1 | 0 | 1.1 | 10.2% |
| Right circle | 1 | 0 | 2.0 | 8.8% |
| Left boards | 1 | 0 | 0.7 | 4.7% |
| Right boards | 1 | 0 | 1.2 | 3.9% |
| Behind the net | — | — | 0.1 | 27.3% |
| Left circle | — | — | 1.1 | 11.0% |
| Behind the net, right | — | — | 0.1 | 4.8% |
| Behind the net, left | — | — | 0.1 | 3.2% |
| Beyond the blue line | — | — | 1.2 | 0.4% |
Dynamo Moscow · 21 shots with coordinates
Center point · 1 of 6★ goal from a low-percentage spot
Left point · 0 of 1▼ fewer shots from here
What stands out
★ goal from a low-percentage spot1Center point: 1 of 6 went in; the league scores on 4.6% of shots from here
▼ fewer shots from here2Left point: 1 shot — Dynamo Moscow usually has 5.8 per game (league 4.7)
All 16 zones
| Zone | Shots | Goals | Average per game | League shooting % |
|---|---|---|---|---|
| Center point▲ | 6 | 1 | 2.7 | 4.6% |
| Right point | 4 | 0 | 5.0 | 3.1% |
| Crease | 2 | 2 | 2.9 | 20.0% |
| Left circle | 2 | 0 | 1.6 | 11.0% |
| Low left | 2 | 0 | 1.3 | 10.2% |
| Slot | 1 | 0 | 2.2 | 16.4% |
| Left boards | 1 | 0 | 1.3 | 4.7% |
| Left point▼ | 1 | 0 | 5.8 | 4.0% |
| Right boards | 1 | 0 | 1.7 | 3.9% |
| Beyond the blue line | 1 | 0 | 1.5 | 0.4% |
| Behind the net | — | — | 0.1 | 27.3% |
| Low right | — | — | 1.0 | 13.0% |
| High slot | — | — | 1.9 | 12.0% |
| Right circle | — | — | 1.1 | 8.8% |
| Behind the net, right | — | — | 0.2 | 4.8% |
| Behind the net, left | — | — | 0.1 | 3.2% |
Every shot is a dot — the bigger it is, the better the chance; red dots with G are goals, thin lines — 16 zones. ▲ and ▼ mark zones where the team shot noticeably more or less often than it usually does (an average KHL team is given for scale); ★ marks goals from spots where under 6% of shots go in. Shots on goal, no empty-net shots.
Sibir won the slot: 12 to 7
Sibir: created 12 — about average, allowed 7 — below average
Dynamo Moscow: created 7 — below average, allowed 12 — about average
We count shots from the crease (0–4 m out from the goal line, 5.4 m wide) and the slot (up to 10.5 m out and 7 m across), the same ones drawn on the map, no empty-net shots. KHL average — 11.6 per team per game; above or below average means a 20%+ difference. Green — good for the team, red — bad.
Sibir
| Player | TOI | G | A | +/− | S | xG |
|---|---|---|---|---|---|---|
| 44Darren Dietz D | 21:49 | 0 | 0 | −1 | 3 | 0.20 |
| 6Nikita And. Smirnov D | 21:08 | 0 | 0 | −2 | 0 | — |
| 74Mikhail Orlov D | 20:31 | 0 | 0 | +1 | 5 | 0.24 |
| 47Ivan Mishchenko D | 20:25 | 0 | 0 | −1 | 3 | 0.07 |
| 21Yegor Alanov D | 16:52 | 1 | 0 | 0 | 5 | 0.55 |
| 18Pavel Tyutnev F | 16:22 | 0 | 0 | 0 | 0 | — |
| 95Alexander Yaremchuk F | 16:17 | 0 | 0 | 0 | 2 | 0.03 |
| 13Stepan Nikulin F | 16:05 | 0 | 0 | 0 | 3 | 0.35 |
| 31Alexander Mirzabalayev F | 15:19 | 0 | 0 | 0 | 1 | 0.02 |
| 34Sergei Popov F | 15:18 | 0 | 0 | 0 | 3 | 0.20 |
| 97Mikhail Abramov F | 15:17 | 0 | 0 | −2 | 2 | 0.53 |
| 28Alexander Pershakov F | 14:35 | 0 | 0 | 0 | 1 | 0.12 |
| 12Arkhip Nekolenko F | 14:30 | 0 | 1 | 0 | 0 | — |
| 71Alexander Kisakov F | 13:29 | 0 | 0 | −2 | 2 | 0.07 |
| 96Yegor Korshkov F | 13:18 | 0 | 1 | 0 | 0 | — |
| 11Semyon Koshelev F | 12:47 | 0 | 0 | 0 | 2 | 0.50 |
| 91Daniil Valitov D | 11:48 | 0 | 0 | −1 | 0 | — |
| 73Ivan Max. Ryabov F | 8:07 | 0 | 0 | 0 | 0 | — |
| 88Ivan Vorobyov F | 6:44 | 0 | 0 | −2 | 0 | — |
| 38Nikita Baklashyov D | 3:26 | 0 | 0 | 0 | 0 | — |
Dynamo Moscow
| Player | TOI | G | A | +/− | S | xG |
|---|---|---|---|---|---|---|
| 45Daniil Pylenkov D | 24:09 | 0 | 0 | 0 | 2 | 0.06 |
| 92Igor Ozhiganov D | 20:49 | 0 | 0 | 0 | 0 | — |
| 93Artyom Sergeyev D | 19:15 | 0 | 0 | +2 | 1 | 0.00 |
| 88Artyom Blazhiyevsky D | 18:14 | 1 | 0 | +2 | 5 | 0.15 |
| 87Yegor Rimashevsky F | 17:21 | 0 | 0 | +1 | 1 | 0.02 |
| 7Maxim Letunov F | 16:55 | 1 | 0 | +1 | 1 | 0.18 |
| 35Nikita Korostelyov F | 16:27 | 0 | 1 | +1 | 1 | 0.10 |
| 14Ivan Igumnov F | 16:03 | 0 | 0 | −1 | 1 | 0.06 |
| 70Igor Martynov F | 15:57 | 0 | 0 | 0 | 1 | 0.02 |
| 57Artyom Shvets-Rogovoi F | 15:42 | 0 | 0 | −1 | 0 | — |
| 22Luka Profaca D | 15:30 | 0 | 1 | 0 | 0 | — |
| 29Bulat Shafigullin F | 15:24 | 0 | 2 | +2 | 2 | 0.03 |
| 16Pavel Shen F | 14:26 | 1 | 1 | +2 | 2 | 0.42 |
| 90Dylan Sikura F | 14:09 | 0 | 0 | +2 | 1 | 0.03 |
| 79Andrei Nikonov F | 13:47 | 0 | 0 | 0 | 1 | 0.15 |
| 9Daniil Davydov F | 12:59 | 0 | 0 | 0 | 0 | — |
| 96Magomed Sharakanov D | 11:50 | 0 | 0 | 0 | 0 | — |
| 47Artyom Bondar F | 10:14 | 0 | 0 | −1 | 2 | 0.30 |
| 43Yelisei Ryabykin D | 5:35 | 0 | 0 | 0 | 0 | — |
| 77Dmitry Zugan F | 0:32 | 0 | 0 | 0 | 0 | — |
Goalies
| Goalie | Team | TOI | Shots | Goals against | Save % |
|---|---|---|---|---|---|
| Vladislav Podyapolsky | Dynamo Moscow | 59:23 | 32 | 1 | 96.9% |
| Anton Krasotkincame in at 20:00 | Sibir | 37:19 | 11 | 0 | 100.0% |
| Mikhail Berdinreplaced at 20:00 | Sibir | 20:00 | 10 | 3 | 70.0% |
Home team on the left. Shots are shots on goal: the KHL doesn't count missed or blocked shots. The total is from the game sheet; xG, slot shots and shots by period — from the KHL shot log with coordinates (no shootout), which can differ from the game sheet by a shot. xG — expected goals by our shot model: how often shots from such spots go in.
Lineups
official lineup · 12:13 MSKSibirDynamo Moscow
Sibir · Line 1Line. Started together in 7 of the last 10 games, 7 points between them.5-on-5 goals on ice 6 : 5 — 18th among lines in the leaguePair. Started together in 10 of the last 10 games, 4 points between them.5-on-5 goals on ice 8 : 12 — 38th among pairs in the league
Dynamo Moscow · Line 1Line. New combination: they have started together no more than once.5-on-5 goals on ice 1 : 1Pair. Started together in 10 of the last 10 games, 14 points between them.5-on-5 goals on ice 10 : 8 — 18th among pairs in the league
Sibir — main threats
Goals this KHL season, empty-net goals excluded.
The percentage is how many shots on goal from this zone became goals. Crease — up to 4 m from the goal line and 2.7 m to each side; slot — from the posts out to the faceoff dots and up to 10.5 m; everything else is other zones.Dynamo Moscow — main threats
Goals this KHL season, empty-net goals excluded.
The percentage is how many shots on goal from this zone became goals. Crease — up to 4 m from the goal line and 2.7 m to each side; slot — from the posts out to the faceoff dots and up to 10.5 m; everything else is other zones.The starting lineup is the official one from the KHL game sheet; before it is out we show an expected lineup based on the team's last five starting lineups.
Expected lineup: we take the players who appeared most often in the last five starting lineups and put each on the line he played most. The home team is on the left and attacks to the right. Within a line the home left wing is on top and the away left wing at the bottom, so wingers face each other as they do on the ice. The centre is our estimate: the forward on the line with the most faceoffs this season. Under the circle — points and games in the regular season (save percentage for goalies). One tag per player, by importance: top 15 in the league at his position, form over the last 5 games by points, a weak side (bottom 15% at his position), ice time. Blue — a strength, red — a weakness, grey — a neutral fact. Tap a player for his full stats. Coaches change lines during a game: these are the starting ones, so «started together» and «goals on ice» can differ. Goals on ice count the goals these players were actually on the ice for, 5-on-5, whatever the starting lineup; the league rank among lines and pairs is shown only from ten goals on ice and is compared with the same kind of combinations.Forecheck forecast
Sibir 45%55% Dynamo Moscow
Updated with the starting lineup (12:35 MSK): Sibir 40% → 45%. The morning forecast came before the lineups; we count this one, the last before the game.
- In Sibir's net — Mikhail Berdin, not the expected Anton Krasotkin: +5.2 pp Sibir
- In Dynamo Moscow's net — Vladislav Podyapolskiy, not the expected Maksim Motorygin: +5.2 pp Sibir
Market (no margin): 44 — 56. Close to the market
Final 1:3 — chances were close to even (45 vs 55): neither a hit nor a miss
Why
- Chance quality (5v5 xG share): +12.5 pp Dynamo Moscow.
- Goalies (starting: Mikhail Berdin vs Vladislav Podyapolsky): +7.4 pp Sibir.
- Home ice: +3.4 pp Sibir.
- Season goal differential (adjusted for special teams): +2.9 pp Dynamo Moscow.
55% vs 45% for Dynamo Moscow, including overtime and shootout. With starting lineups, at 12:35 MSK. Locked before the game and never changed. How it works
Match discussion · 0
No comments yet — be the first.