Avtomobilist vs Ak Bars: prediction
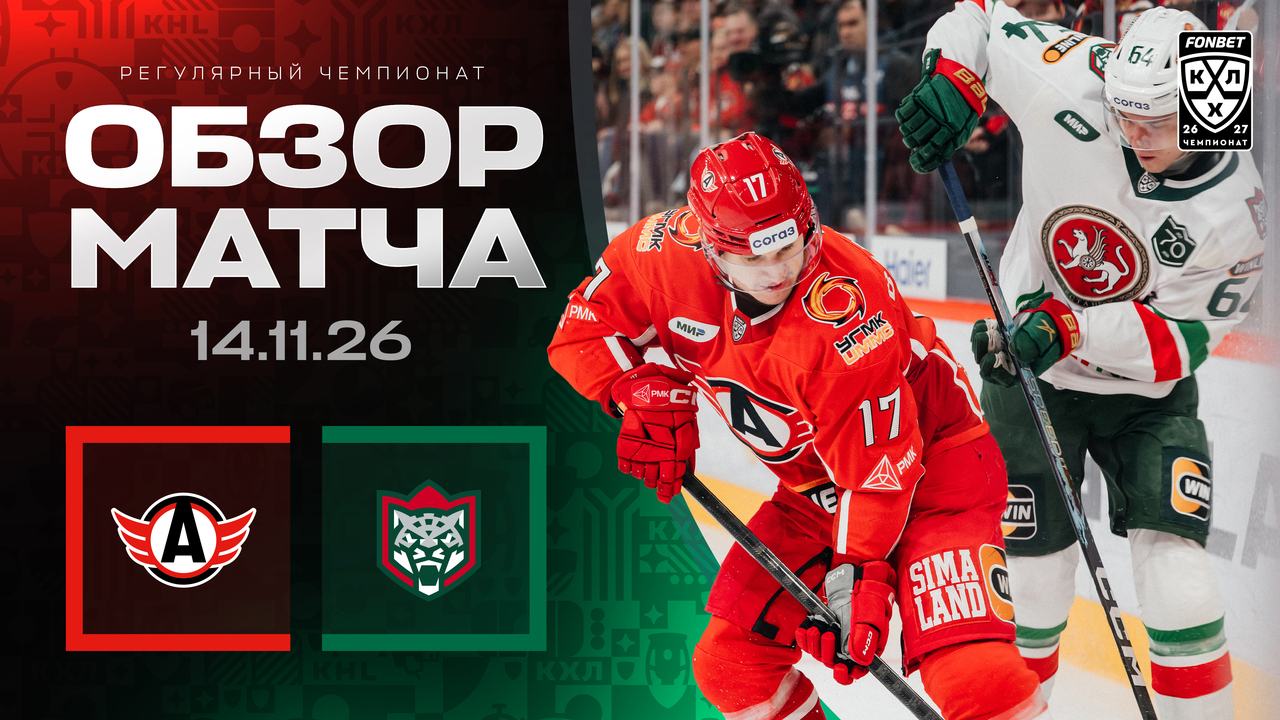
Game stats
Goals
- 13:171:0Alexander Barabanov (Avtomobilist)▶ video
- 13:422:0Ilya Karpukhin (Avtomobilist) · assists: Daniel Sprong, Alexander Kadeikin▶ video
- 6:353:0Adam Ruzicka (Avtomobilist) · assists: Daniel Sprong, Alexander Kadeikin▶ video
- 7:103:1Maxim Dm. Bykov (Ak Bars)▶ video
- 16:024:1Maxim Denezhkin (Avtomobilist) · assists: Ilya Karpukhin, Alexander Barabanov▶ video
- 14:175:1Alexander Barabanov (Avtomobilist) · assists: Daniel Sprong, Artyom Kashtanov▶ video
Teams
| Avtomobilist | Ak Bars | ||
|---|---|---|---|
| Shots on goal | 27 | 28 | |
| Expected goals (xG) | 2.75 | 1.73 | |
| From the crease and slot | 14 | 5 |
By period
| Goals | Shots | |
|---|---|---|
| 1st period | 2 : 0 | 9 : 7 |
| 2nd period | 2 : 1 | 15 : 6 |
| 3rd period | 1 : 0 | 3 : 15 |
Where the shots and goals came from
Nothing unusual: every zone is within the normal range for Avtomobilist.
All 16 zones
| Zone | Shots | Goals | Average per game | League shooting % |
|---|---|---|---|---|
| Right point | 5 | 0 | 4.3 | 3.1% |
| Slot | 4 | 1 | 3.1 | 16.4% |
| Crease | 3 | 2 | 3.2 | 20.0% |
| Right circle | 3 | 1 | 1.8 | 8.8% |
| Left circle | 2 | 1 | 1.7 | 11.0% |
| Low left | 2 | 0 | 1.3 | 10.2% |
| Left boards | 2 | 0 | 0.8 | 4.7% |
| Center point | 2 | 0 | 2.8 | 4.6% |
| Left point | 2 | 0 | 3.9 | 4.0% |
| Low right | 1 | 0 | 1.5 | 13.0% |
| High slot | 1 | 0 | 2.3 | 12.0% |
| Behind the net | — | — | 0.1 | 27.3% |
| Behind the net, right | — | — | 0.1 | 4.8% |
| Right boards | — | — | 0.7 | 3.9% |
| Behind the net, left | — | — | 0.1 | 3.2% |
| Beyond the blue line | — | — | 0.6 | 0.4% |
All 16 zones
| Zone | Shots | Goals | Average per game | League shooting % |
|---|---|---|---|---|
| Right point▲ | 11 | 0 | 5.0 | 3.1% |
| Center point | 4 | 0 | 3.5 | 4.6% |
| Left circle | 3 | 0 | 1.5 | 11.0% |
| Left point | 3 | 0 | 4.2 | 4.0% |
| Crease | 2 | 0 | 2.4 | 20.0% |
| Right circle | 2 | 0 | 2.0 | 8.8% |
| Slot | 1 | 1 | 2.6 | 16.4% |
| Behind the net, right | 1 | 0 | 0.0 | 4.8% |
| Beyond the blue line | 1 | 0 | 1.0 | 0.4% |
| Behind the net | — | — | 0.1 | 27.3% |
| Low right | — | — | 0.9 | 13.0% |
| High slot | — | — | 2.3 | 12.0% |
| Low left | — | — | 0.8 | 10.2% |
| Left boards | — | — | 0.7 | 4.7% |
| Right boards | — | — | 0.7 | 3.9% |
| Behind the net, left | — | — | 0.2 | 3.2% |
Every shot is a dot — the bigger it is, the better the chance; red dots with G are goals, thin lines — 16 zones. ▲ and ▼ mark zones where the team shot noticeably more or less often than it usually does (an average KHL team is given for scale); ★ marks goals from spots where under 6% of shots go in. Shots on goal, no empty-net shots.
Avtomobilist
| Player | TOI | G | A | +/− | S | xG |
|---|---|---|---|---|---|---|
| 79Jordan Gross D | 19:56 | 0 | 0 | +1 | 4 | 0.25 |
| 7Yaroslav Busygin D | 19:31 | 0 | 0 | +1 | 1 | 0.06 |
| 89Ilya Karpukhin D | 19:24 | 1 | 1 | +3 | 3 | 0.24 |
| 86Alexander Sharov F | 19:23 | 0 | 0 | 0 | 1 | 0.19 |
| 88Nikita Tryamkin D | 19:08 | 0 | 0 | +2 | 0 | — |
| 21Adam Ruzicka F | 18:54 | 1 | 0 | +2 | 2 | 0.14 |
| 55Kirill Vorobyov D | 18:16 | 0 | 0 | 0 | 0 | — |
| 11Daniel Sprong F | 18:14 | 0 | 3 | +3 | 3 | 0.17 |
| 17Alexander Barabanov F | 18:11 | 2 | 1 | +3 | 4 | 0.63 |
| 44Dmitry Yudin D | 17:10 | 0 | 0 | +1 | 0 | — |
| 78Alexander Kadeikin F | 15:11 | 0 | 2 | +2 | 0 | — |
| 24Maxim Denezhkin F | 14:57 | 1 | 0 | +2 | 4 | 0.34 |
| 92Roman Gorbunov F | 14:56 | 0 | 0 | 0 | 1 | 0.08 |
| 15Anatoly Golyshev F | 13:56 | 0 | 0 | 0 | 0 | — |
| 76Artyom Kashtanov F | 13:15 | 0 | 1 | +3 | 1 | 0.16 |
| 52Ilya Ovchinnikov F | 9:21 | 0 | 0 | −1 | 2 | 0.29 |
| 99Nikita Shashkov F | 8:20 | 0 | 0 | −1 | 1 | 0.19 |
| 19Yegor Chernikov F | 2:36 | 0 | 0 | −1 | 0 | — |
| 94Georgy Kaigorodov D | 2:09 | 0 | 0 | 0 | 0 | — |
| 63Dmitry Isayev F | 1:39 | 0 | 0 | 0 | 0 | — |
Ak Bars
| Player | TOI | G | A | +/− | S | xG |
|---|---|---|---|---|---|---|
| 96Nikita Lyamkin D | 21:52 | 0 | 0 | −2 | 2 | 0.05 |
| 33Albert Yarullin D | 19:02 | 0 | 0 | −2 | 1 | 0.03 |
| 94Kirill Semyonov F | 19:00 | 0 | 0 | −1 | 0 | — |
| 44Nikita Yevseyev D | 18:01 | 0 | 0 | −1 | 2 | 0.06 |
| 22Alexei Byvaltsev F | 16:49 | 0 | 0 | −2 | 0 | — |
| 92Dmitry Katelevsky F | 16:38 | 0 | 0 | 0 | 0 | — |
| 28Stepan Terekhov D | 16:36 | 0 | 0 | −1 | 2 | 0.04 |
| 53Alexei Marchenko D | 16:32 | 0 | 0 | −1 | 1 | 0.03 |
| 55Alexander Chmelevski F | 16:17 | 0 | 0 | −1 | 2 | 0.10 |
| 86Nikita Dynyak F | 16:00 | 0 | 0 | 0 | 3 | 0.12 |
| 29Ravil Yakupov F | 15:15 | 0 | 0 | −2 | 1 | 0.20 |
| 59Semyon Terekhov F | 14:55 | 0 | 0 | 0 | 2 | 0.10 |
| 14Grigory Denisenko F | 14:45 | 0 | 0 | −1 | 6 | 0.31 |
| 16Denis Zernov F | 14:00 | 0 | 0 | −2 | 3 | 0.35 |
| 23Andrei Stas F | 13:40 | 0 | 0 | −1 | 0 | — |
| 32Igor Bardin D | 13:29 | 0 | 0 | 0 | 1 | 0.06 |
| 37Maxim Dm. Bykov F | 11:38 | 1 | 0 | 0 | 2 | 0.26 |
| 26Yegor Sokolov F | 8:20 | 0 | 0 | −2 | 0 | — |
| 64Konstantin Nikitin D | 7:36 | 0 | 0 | −1 | 0 | — |
Goalies
| Goalie | Team | TOI | Shots | Goals against | Save % |
|---|---|---|---|---|---|
| Timur Bilyalov | Ak Bars | 60:00 | 27 | 5 | 81.5% |
| Vladimir Galkin | Avtomobilist | 59:57 | 28 | 1 | 96.4% |
Home team on the left. Shots are shots on goal: the KHL doesn't count missed or blocked shots. The total is from the game sheet; xG, slot shots and shots by period — from the KHL shot log with coordinates (no shootout), which can differ from the game sheet by a shot. xG — expected goals by our shot model: how often shots from such spots go in.
Lineups
official lineup · 13:35 MSKGoals this KHL season, empty-net goals excluded.
The percentage is how many shots on goal from this zone became goals. Crease — up to 4 m from the goal line and 2.7 m to each side; slot — from the posts out to the faceoff dots and up to 10.5 m; everything else is other zones.Goals this KHL season, empty-net goals excluded.
The percentage is how many shots on goal from this zone became goals. Crease — up to 4 m from the goal line and 2.7 m to each side; slot — from the posts out to the faceoff dots and up to 10.5 m; everything else is other zones.The starting lineup is the official one from the KHL game sheet; before it is out we show an expected lineup based on the team's last five starting lineups.
Expected lineup: we take the players who appeared most often in the last five starting lineups and put each on the line he played most. The home team is on the left and attacks to the right. Within a line the home left wing is on top and the away left wing at the bottom, so wingers face each other as they do on the ice. The centre is our estimate: the forward on the line with the most faceoffs this season. Under the circle — points and games in the regular season (save percentage for goalies). One tag per player, by importance: top 15 in the league at his position, form over the last 5 games by points, a weak side (bottom 15% at his position), ice time. Blue — a strength, red — a weakness, grey — a neutral fact. Tap a player for his full stats. Coaches change lines during a game: these are the starting ones, so «started together» and «goals on ice» can differ. Goals on ice count the goals these players were actually on the ice for, 5-on-5, whatever the starting lineup; the league rank among lines and pairs is shown only from ten goals on ice and is compared with the same kind of combinations.- In Avtomobilist's net — Vladimir Galkin, not the expected Evgeniy Alikin: +3.2 pp Avtomobilist
- In Ak Bars's net — Timur Bilyalov, not the expected Maksim Arefev: +3.2 pp Avtomobilist
- Goal difference: +0.8 pp Ak Bars
- Goalies (starting: Vladimir Galkin vs Timur Bilyalov): +7.3 pp Avtomobilist.
- Home ice: +3.4 pp Avtomobilist.
- Season goal differential (adjusted for special teams): +2.1 pp Avtomobilist.
- Chance quality (5v5 xG share): +1.2 pp Ak Bars.
Match discussion · 0
No comments yet — be the first.