Thursday 19 November, 19:30 MSK · Nizhnekamsk
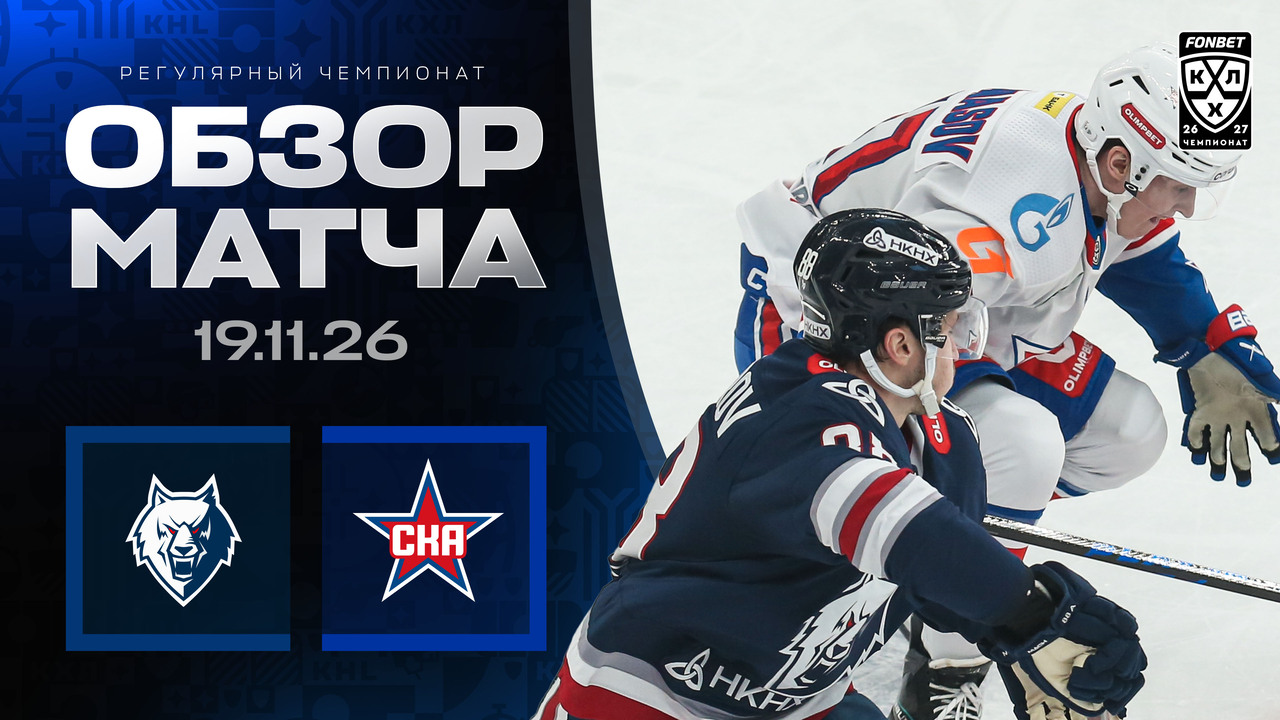
Neftekhimik vs SKA: prediction
final19:30 MSK
НХКNeftekhimikhome
2:3
SKAawayСКА
Game stats
Goals
1st period
- 14:490:1Nikita Nedopyokin (SKA) · assists: Ignat Lutfullin, Yury Zhuravlyov · power play▶ video
2nd period
- 4:201:1Andrei Al. Belozyorov (Neftekhimik) · assists: Damir Zhafyarov, Ilya Pastukhov▶ video
- 8:131:2Rocco Grimaldi (SKA) · assists: Nikolai Goldobin▶ video
3rd period
- 1:511:3Vasily Glotov (SKA)▶ video
- 10:442:3Matvei Nadvorny (Neftekhimik) · assists: Nikita Khlystov▶ video
Teams
| Neftekhimik | SKA | ||
|---|---|---|---|
| Shots on goal | 43 | 31 | |
| Expected goals (xG) | 3.68 | 2.10 | |
| From the crease and slot | 20 | 7 |
By period
| Goals | Shots | |
|---|---|---|
| 1st period | 0 : 1 | 7 : 15 |
| 2nd period | 1 : 1 | 19 : 8 |
| 3rd period | 1 : 1 | 17 : 8 |
Where the shots and goals came from
Neftekhimik · 43 shots with coordinates
Left circle · 1 of 8▲ more shots from here
What stands out
▲ more shots from here1Left circle: 8 shots — Neftekhimik usually has 2.0 per game (league 1.7)
All 16 zones
| Zone | Shots | Goals | Average per game | League shooting % |
|---|---|---|---|---|
| Left circle▲ | 8 | 1 | 2.0 | 11.0% |
| Right point | 8 | 0 | 5.3 | 3.1% |
| Slot | 5 | 0 | 3.4 | 16.4% |
| Center point | 5 | 0 | 2.7 | 4.6% |
| Left point | 4 | 0 | 4.7 | 4.0% |
| Low right | 3 | 0 | 1.6 | 13.0% |
| Crease | 2 | 0 | 3.0 | 20.0% |
| Low left | 2 | 0 | 2.0 | 10.2% |
| Right circle | 2 | 1 | 1.7 | 8.8% |
| High slot | 1 | 0 | 1.7 | 12.0% |
| Left boards | 1 | 0 | 0.9 | 4.7% |
| Right boards | 1 | 0 | 1.1 | 3.9% |
| Beyond the blue line | 1 | 0 | 1.0 | 0.4% |
| Behind the net | — | — | 0.1 | 27.3% |
| Behind the net, right | — | — | 0.1 | 4.8% |
| Behind the net, left | — | — | 0.1 | 3.2% |
SKA · 31 shots with coordinates
Left boards · 0 of 4▲ more shots from here
What stands out
▲ more shots from here1Left boards: 4 shots — SKA usually has 1.0 per game (league 1.0)
All 16 zones
| Zone | Shots | Goals | Average per game | League shooting % |
|---|---|---|---|---|
| Left point | 7 | 0 | 5.6 | 4.0% |
| Right point | 7 | 0 | 5.5 | 3.1% |
| Slot | 4 | 1 | 2.3 | 16.4% |
| Left boards▲ | 4 | 0 | 1.0 | 4.7% |
| High slot | 2 | 2 | 2.3 | 12.0% |
| Left circle | 2 | 0 | 1.5 | 11.0% |
| Center point | 2 | 0 | 2.7 | 4.6% |
| Low right | 1 | 0 | 1.5 | 13.0% |
| Right circle | 1 | 0 | 1.8 | 8.8% |
| Beyond the blue line | 1 | 0 | 0.9 | 0.4% |
| Behind the net | — | — | 0.0 | 27.3% |
| Crease | — | — | 1.6 | 20.0% |
| Low left | — | — | 1.5 | 10.2% |
| Behind the net, right | — | — | 0.1 | 4.8% |
| Right boards | — | — | 1.2 | 3.9% |
| Behind the net, left | — | — | 0.3 | 3.2% |
Every shot is a dot — the bigger it is, the better the chance; red dots with G are goals, thin lines — 16 zones. ▲ and ▼ mark zones where the team shot noticeably more or less often than it usually does (an average KHL team is given for scale); ★ marks goals from spots where under 6% of shots go in. Shots on goal, no empty-net shots.
Neftekhimik won the slot: 20 to 7
Neftekhimik: created 20 — above average, allowed 7 — below average
SKA: created 7 — below average, allowed 20 — above average
We count shots from the crease (0–4 m out from the goal line, 5.4 m wide) and the slot (up to 10.5 m out and 7 m across), the same ones drawn on the map, no empty-net shots. KHL average — 11.6 per team per game; above or below average means a 20%+ difference. Green — good for the team, red — bad.
Neftekhimik
| Player | TOI | G | A | +/− | S | xG |
|---|---|---|---|---|---|---|
| 24Artyom Serikov D | 20:33 | 0 | 0 | 0 | 7 | 0.21 |
| 52Evgeny Mityakin F | 19:52 | 0 | 0 | 0 | 1 | 0.21 |
| 71Andrei Al. Belozyorov F | 18:39 | 1 | 0 | +1 | 5 | 0.52 |
| 33German Tochilkin F | 18:30 | 0 | 0 | 0 | 4 | 0.68 |
| 55Ilya Pastukhov D | 17:54 | 0 | 1 | −2 | 4 | 0.14 |
| 88Damir Zhafyarov F | 17:19 | 0 | 1 | +1 | 4 | 0.36 |
| 57Semyon Ruchkin D | 16:42 | 0 | 0 | +1 | 0 | — |
| 65Maxim Fedotov D | 15:39 | 0 | 0 | +1 | 2 | 0.03 |
| 7Nikita Khlystov D | 15:31 | 0 | 1 | +1 | 1 | 0.04 |
| 11Ivan Nikolishin F | 15:12 | 0 | 0 | −1 | 1 | 0.08 |
| 21Grigory Seleznyov F | 15:09 | 0 | 0 | 0 | 2 | 0.24 |
| 23Alexander Petunin F | 15:03 | 0 | 0 | −2 | 4 | 0.49 |
| 81Vladislav Yeryomenko D | 15:01 | 0 | 0 | 0 | 1 | 0.05 |
| 97Artur Tyanulin F | 14:13 | 0 | 0 | −1 | 1 | 0.10 |
| 84Sergei Artemyev F | 12:51 | 0 | 0 | +1 | 1 | 0.17 |
| 10Rafael Bikmullin F | 11:59 | 0 | 0 | 0 | 1 | 0.02 |
| 29Timur Khairullin D | 11:31 | 0 | 0 | −1 | 1 | 0.13 |
| 87Sevastyan Sokolov F | 11:25 | 0 | 0 | 0 | 0 | — |
| 17Matvei Nadvorny F | 10:36 | 1 | 0 | +1 | 3 | 0.23 |
| 62Amir Gizyatov F | 0:25 | 0 | 0 | 0 | 0 | — |
SKA
| Player | TOI | G | A | +/− | S | xG |
|---|---|---|---|---|---|---|
| 22Nikita Zaitsev D | 20:09 | 0 | 0 | −1 | 1 | 0.03 |
| 34Yegor Savikov D | 18:49 | 0 | 0 | −1 | 1 | 0.06 |
| 85Alexei Maklyukov D | 18:24 | 0 | 0 | 0 | 0 | — |
| 58Yury Zhuravlyov D | 18:22 | 0 | 1 | +1 | 3 | 0.06 |
| 7Vasily Glotov F | 17:59 | 1 | 0 | +1 | 6 | 0.48 |
| 87Nikolai Goldobin F | 17:23 | 0 | 1 | 0 | 1 | 0.03 |
| 71Matvei Korotky F | 16:42 | 0 | 0 | 0 | 1 | 0.12 |
| 9Sergei Sapego D | 16:38 | 0 | 0 | 0 | 2 | 0.03 |
| 17Vasily Atanasov F | 16:13 | 0 | 0 | 0 | 3 | 0.29 |
| 23Rocco Grimaldi F | 15:36 | 1 | 0 | +1 | 4 | 0.45 |
| 47Nikita Nedopyokin F | 14:53 | 1 | 0 | 0 | 3 | 0.22 |
| 55Nikita Dishkovsky F | 14:43 | 0 | 0 | 0 | 0 | — |
| 53Danil Aimurzin F | 14:09 | 0 | 0 | −1 | 2 | 0.09 |
| 62Daniil Miromanov D | 13:27 | 0 | 0 | +1 | 0 | — |
| 98Vladislav Romanov F | 13:21 | 0 | 0 | 0 | 1 | 0.03 |
| 91Ignat Lutfullin F | 11:10 | 0 | 1 | 0 | 0 | — |
| 78German Suzdorf F | 11:10 | 0 | 0 | 0 | 0 | — |
| 88Amir Nugmanov F | 10:53 | 0 | 0 | −1 | 2 | 0.19 |
| 42Vladislav Syomin D | 9:11 | 0 | 0 | 0 | 1 | 0.03 |
| 21Daniil Savin F | 1:37 | 0 | 0 | 0 | 0 | — |
Goalies
| Goalie | Team | TOI | Shots | Goals against | Save % |
|---|---|---|---|---|---|
| Filipp Dolganovpulled: 2:07–2:10, 59:09– | Neftekhimik | 59:06 | 31 | 3 | 90.3% |
| Artemy Pleshkov | SKA | 60:00 | 43 | 2 | 95.3% |
Home team on the left. Shots are shots on goal: the KHL doesn't count missed or blocked shots. The total is from the game sheet; xG, slot shots and shots by period — from the KHL shot log with coordinates (no shootout), which can differ from the game sheet by a shot. xG — expected goals by our shot model: how often shots from such spots go in.
Lineups
official lineup · 18:30 MSKNeftekhimikSKA
Neftekhimik · Line 1Line. New combination: they have started together no more than once.5-on-5 goals on ice 1 : 1Pair. Started together in 9 of the last 10 games, 2 points between them.5-on-5 goals on ice 2 : 6
SKA · Line 1Line. New combination: they have started together no more than once.5-on-5 goals on ice 2 : 0Pair. Started together in 7 of the last 10 games, 4 points between them.5-on-5 goals on ice 6 : 4 — 20th among pairs in the league
Neftekhimik — main threats
Goals this KHL season, empty-net goals excluded.
The percentage is how many shots on goal from this zone became goals. Crease — up to 4 m from the goal line and 2.7 m to each side; slot — from the posts out to the faceoff dots and up to 10.5 m; everything else is other zones.SKA — main threats
Goals this KHL season, empty-net goals excluded.
The percentage is how many shots on goal from this zone became goals. Crease — up to 4 m from the goal line and 2.7 m to each side; slot — from the posts out to the faceoff dots and up to 10.5 m; everything else is other zones.The starting lineup is the official one from the KHL game sheet; before it is out we show an expected lineup based on the team's last five starting lineups.
Expected lineup: we take the players who appeared most often in the last five starting lineups and put each on the line he played most. The home team is on the left and attacks to the right. Within a line the home left wing is on top and the away left wing at the bottom, so wingers face each other as they do on the ice. The centre is our estimate: the forward on the line with the most faceoffs this season. Under the circle — points and games in the regular season (save percentage for goalies). One tag per player, by importance: top 15 in the league at his position, form over the last 5 games by points, a weak side (bottom 15% at his position), ice time. Blue — a strength, red — a weakness, grey — a neutral fact. Tap a player for his full stats. Coaches change lines during a game: these are the starting ones, so «started together» and «goals on ice» can differ. Goals on ice count the goals these players were actually on the ice for, 5-on-5, whatever the starting lineup; the league rank among lines and pairs is shown only from ten goals on ice and is compared with the same kind of combinations.Forecheck forecast
Neftekhimik 49.9%50.1% SKA
Updated with the starting lineup (18:35 MSK): SKA 48.0% → 50.1%. The morning forecast came before the lineups; we count this one, the last before the game.
- In SKA's net — Artemiy Pleshkov, not the expected Sergey Vl. Ivanov: +2.1 pp SKA
Market (no margin): 47 — 53. Close to the market
Final 2:3 — chances were close to even (50 vs 50): neither a hit nor a miss
Why
- Season goal differential (adjusted for special teams): +4.5 pp SKA.
- Chance quality (5v5 xG share): +3.9 pp Neftekhimik.
- Home ice: +3.4 pp Neftekhimik.
- Goalies (starting: Filipp Dolganov vs Artemy Pleshkov): +2.9 pp SKA.
50.1% vs 49.9% for SKA, including overtime and shootout. With starting lineups, at 18:35 MSK. Locked before the game and never changed. How it works
Match discussion · 0
No comments yet — be the first.